Cole Page
Credit Analyst · cole.page.2027@anderson.ucla.edu · colehpage.com
AppLovin: BUY at $260 Ahead of the First Full E-commerce Quarter
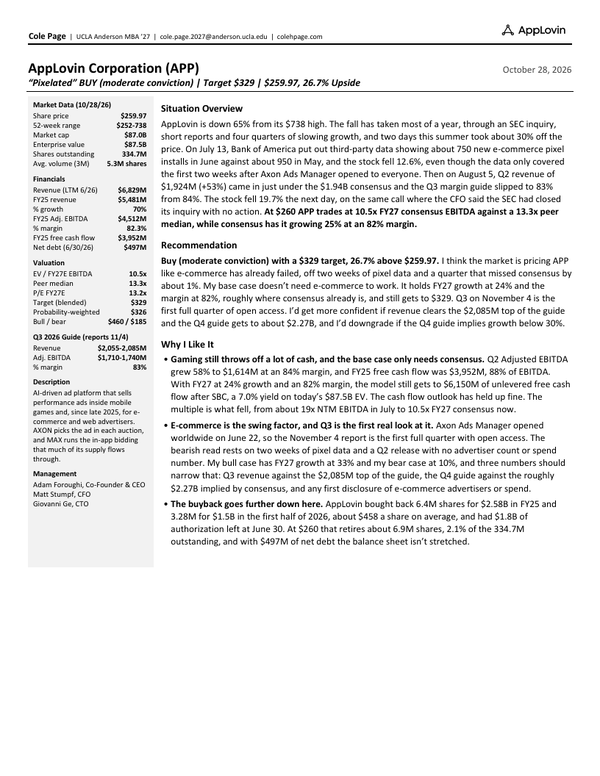
BUY at $259.97 with a $329 target. An SEC inquiry, short reports, four quarters of slowing growth and a weak summer have taken the stock from $738 to 10.5x FY27 EBITDA against a 13.3x peer median, and my base case only needs consensus numbers.
The Call
BUY, moderate conviction, with a $329 target, 26.7% above $259.97. AppLovin is down 65% from its $738 high and trades at 10.5x FY27 consensus EBITDA against a 13.3x peer median, while consensus has it growing 25% at an 82% margin. I think the market is pricing APP as if e-commerce has already failed. My base case doesn't need e-commerce to work: it holds FY27 growth at 24% and the margin at 82%, roughly where consensus already is, and still gets to $329.
| 10/28/26 | APP | Peer median |
|---|---|---|
| Price | $259.97 | |
| EV / FY27E EBITDA | 10.5x | 13.3x |
| P/E FY27E | 13.2x | 18.1x |
| FY27E revenue growth | 25.1% | 21.8% |
| FY27E EBITDA margin | 82.0% | |
| Target (blended) | $329, +26.7% | |
| Bull / bear | $460 / $185 |
Q3 on November 4 is the first full quarter since Axon Ads Manager opened to all advertisers. I'd get more confident if revenue clears the $2,085M top of the guide and the Q4 guide gets to about $2.27B, and I'd downgrade if the Q4 guide implies growth below 30%.
How It Got to $260
The fall has taken most of a year. The stock peaked at $738 in December 2025 and was below $400 by February, while the SEC inquiry into AppLovin's data collection (reported by Bloomberg in October 2025) was still open, along with the state AG inquiries the New York Post reported and short reports arguing that AXON depends on data practices that break platform rules. Growth has also slowed four quarters in a row, from 77% y/y in Q2 2025 to 53% in Q2 2026.
The stock was back above $600 in early June, and then the summer took it down again. On July 13 Bank of America put out third-party data showing about 750 new e-commerce pixel installs in June against about 950 in May, and the stock fell 12.6%, even though the data covered only the first two weeks after Ads Manager opened on June 22. On August 5, Q2 revenue of $1,924M (+53%) came in just under the $1.94B consensus, the Q3 margin guide slipped to 83% from 84%, and the stock fell 19.7% the next day. That was the same call where the CFO said the SEC had closed its inquiry with no action, which tells me the market was more worried about growth than regulation by then. Since August the stock has drifted from the low $300s to $260.
The summer is what reset the multiple, from about 19x NTM EBITDA in July to 10.5x FY27 consensus now. That reset rests on two weeks of pixel data and a miss of about 1%, before the first full quarter of open access and before AppLovin has published an advertiser count or a spend number for e-commerce.
Why I Like It
Gaming still produces a lot of cash, and the base case only needs consensus. Q2 Adjusted EBITDA grew 58% to $1,614M at an 84% margin, and FY25 free cash flow was $3,952M, 88% of EBITDA. At 24% FY27 growth and an 82% margin, the model gets to $6,150M of unlevered free cash flow after SBC, a 7.0% yield on the $87.5B EV. The cash flow outlook has held up. What fell was the multiple.
E-commerce is the swing factor, and Q3 is the first real look at it. My bull case has FY27 growth at 33% and my bear case at 10%. Three numbers on November 4 should narrow that range: Q3 revenue against the $2,085M top of the guide, the Q4 guide against the roughly $2.27B that consensus implies, and any first disclosure of e-commerce advertisers or spend.
The buyback goes further at $260. AppLovin bought back 3.28M shares for $1.5B in the first half of 2026, about $458 a share on average, and had $1.8B of authorization left at June 30. At $260 that buys about 6.9M shares, 2.1% of the 334.7M outstanding and 76% more stock than at the first-half average. Net debt is $497M, about 0.1x EBITDA.
How I Get to $329
I blend three methods 25/25/50: a DCF with 3.0% perpetual growth ($322), a DCF with a 12x FY31 EBITDA exit ($363), and 13x, the FY27 peer median, on my base FY27 EBITDA of $8,214M ($316). The near-term multiple gets half the weight because this is a 12-month target. Both DCFs discount at a 10.8% WACC to 12/31/26.
| Scenario (weight) | FY27E growth | Blended | vs. $259.97 |
|---|---|---|---|
| Bull (25%) | 33% | $460 | +77% |
| Base (50%) | 24% | $329 | +27% |
| Bear (25%) | 10% | $185 | -29% |
| Probability-weighted | $326 | +25% |
The discount rate is the biggest single assumption. My 10.8% uses a bottom-up beta of 1.34, built from Damodaran's Advertising and Software (Internet) industry betas. The adjusted 5-year beta that most coverage lists show is 2.04, which gives a 13.8% WACC and a blended value of $297. I don't use it because that window covers the 2022 crash and the 2023-25 run, so it measures how the stock traded more than how risky the business is. Still, roughly half the upside in my target comes from that choice. Terminal value is 71-75% of enterprise value in both DCFs, so this is mostly a view on what the business looks like in 2031.
What Could Go Wrong
The obvious risk is that e-commerce doesn't work. If Ads Manager adds advertisers slowly, or they stop spending once the test budgets run out, FY27 looks more like my 10% bear case than the 25% consensus, and Meta and Google have far more first-party shopping data than AppLovin does. My base case doesn't need e-commerce to beat consensus, but a weak first disclosure would hit the multiple even if gaming holds up.
The SEC inquiry is closed, but a securities class action is pending (lead plaintiff deadline November 16), and the state AG inquiries and short reports are still out there. A platform policy change aimed at the data practices the short reports describe would hit the model directly, and none of my scenarios price it. Most revenue still comes from game advertisers reaching users inside apps that Apple and Google distribute, and a rule aimed at mediation would go straight at MAX.
Growth depends on how often AppLovin ships AXON model improvements. Net revenue per install rose 58% in Q2 while installs fell 2%, and those improvements come unevenly. With a one-year beta above 2, the stock also moves more than peers in a selloff. The bear case at $185 is 29% below the price, about the same size as the base-case upside.
What Would Change My Mind
| Signal | Now | More conviction | Downgrade |
|---|---|---|---|
| Q3 revenue (11/4) | Guide $2,055-2,085M | At or above $2,085M | |
| Q4 revenue guide | ~$2.27B implied by consensus | Above $2.27B | Implies growth below 30% y/y |
| Adj. EBITDA margin | 83% Q3 guide | 83% or better | Guide below 80% |
| E-commerce disclosure | None yet | First advertiser count or spend figure | |
| Legal and platform | SEC closed; class action pending | Dismissal or settlement | Platform or court finding against AXON's data practices |
| Share price | $259.97 | Below $210 (~8.5x FY27E consensus EBITDA) | Above $330 (peer-median multiple on consensus) |